
Welcome to our data pages. The Reading Hydro Digital team collects raw data from the turbine house control systems and processes it into the format you see displayed on the website. Live data is needed by our Operations and Maintenance team and the Environment Agency to keep a check on how the hydro plant is working. But equally importantly, we want it to be available for anyone to see.
Data summary

The data summary page gives a snapshot of all the current data – the power generation of each screw turbine/generator, water levels, and temperature and humidity in the turbine house. There are then links to more detailed pages, with graphs showing historical data for some measurements. At the foot of each page is a key with explanatory notes about each of the measurements shown.
Power generation data
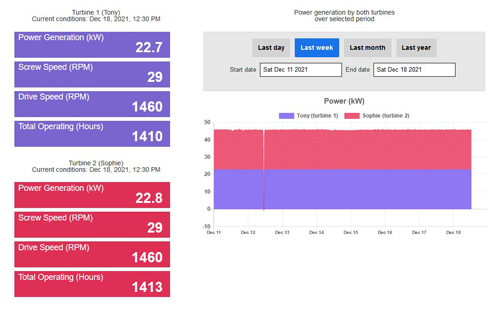
The power generation data page shows the electrical power currently being generated by each screw turbine/generator in kilowatts (kW). It also shows historical data for power generation.. You can select different time spans for viewing the historical data using the controls above the graph. You can also click on the labels above the graph to see the individual performance of each turbine/generator. The turbines are named Tony and Sophie after the two people that our Board agreed did the most to make Reading Hydro happen.
River conditions data
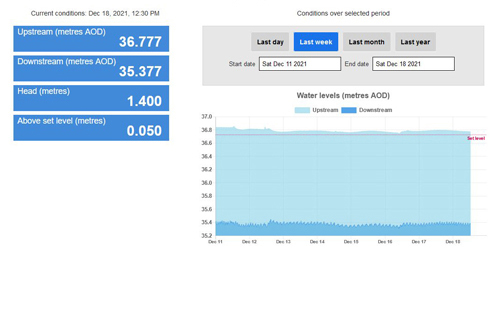
The river conditions data page shows the current levels of the river above and below the turbines. It also shows historical values of these levels. You can select different time spans for viewing the historical data using the controls above the graph. You can also click on the labels above the graph to see the upstream and downstream river levels in more detail. The difference between these two levels is the distance that the water falls going over the weir, and is called the head. We are allowed to operate the hydro plant only when the water upstream is above a threshold agreed by the Environment Agency, called the ‘set level’.
Turbine house data
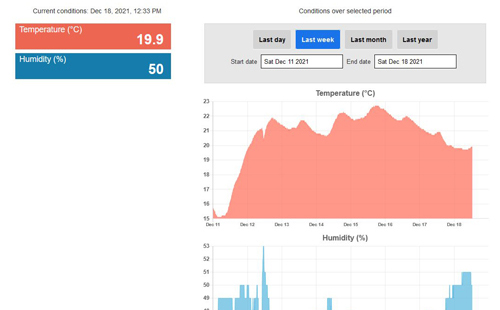
The turbine house data page shows the current temperature and relative humidity inside the turbine house. It also shows historical values of these measurements. You can select different time spans for viewing the historical data using the controls above the graphs.
For anyone interested in the technology behind our data processing, it is documented on our github page.