
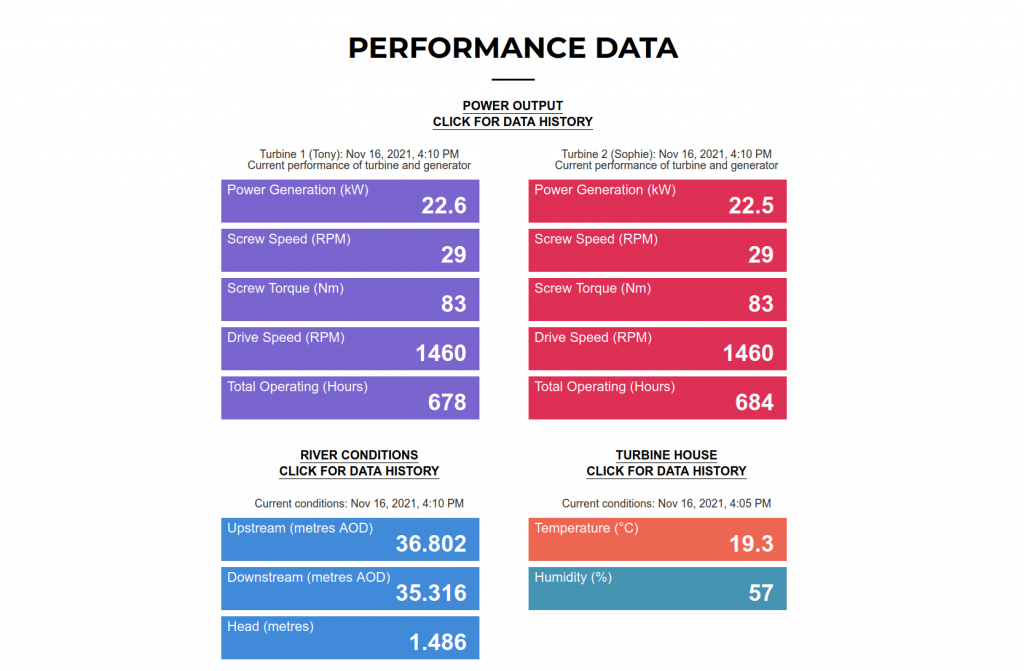
Preview of the data summary page
Great news! Reading Hydro’s turbines have both been running full-time since 22nd November (apart from short periods of scheduled maintenance on Saturday mornings).
You can see this for yourself on the Performance data pages of our website. The main page gives a snapshot of all the data – the current power generation of each turbine/generator, the water levels, and the turbine house environmental conditions. There are then links to more detailed pages on Power generation, Water levels, and the Environmental conditions. These have graphs that show historical data for some values. You can look at the performance over different time periods, and for one or both turbines.
It’s thanks to Reading Hydro’s fantastic Digital team that we have these pages. Live data is needed by our operations and maintenance O&M team and the Environment Agency to keep a check on how the hydro plant is working. But equally important, we want it to be available for anyone to see.
The team collects raw data from the turbine house control system, and processes it into the website display format. There have been teething problems including checking sensor calibrations, so we aren’t displaying water flow because we’re not yet satisfied with these measurements.
The Digital team is constantly improving the data display to make it easier to read, and more accessible for people with visual impairment. Our website usage stats show that (not surprisingly!) the data pages are the most popular ones on our website, and many people view them from mobile phones. So the processing has been changed to make the data display update more quickly, and look better on mobile browsers.
For anyone interested in the technology behind this, it is documented on our github page.
Thanks to all the Reading Hydro Digital team – Arabela, Mark, Stuart, Bapu and in particular Lynda for the website work.
I was hoping the links such as “click for data history” would show how much the Hydro is generating / has generated. None of the links seem to do anything and I can’t find anything else on the website to give me that sort of information.
I’m interested as a shareholder/investor.
Thanks for your comment.
If you follow the link to the ‘Power generation data’ page, then the total generation to date is in the purple box at the top left of the display. If you select ‘Last year’ as the selected period, you will see a graph of power generated for the past 12 months.
Hovering at the top of the red or the mauve block gives the numerical value of the power from each turbine at a particular time.