

Reading Hydro volunteer Wilson Chan is a PhD student at Reading University, carrying out research on the impacts of climate change on UK water resources. He’s applied his data modelling expertise to predict likely flow in the River Thames over the next few months. In a future blog he’ll update the data and also discuss the likely impact of climate change on the Thames flow. It’s great to have Wilson’s data modelling expertise to help us understand river flow better (even though the outlook is somewhat gloomy for the next few months….).
July 2022 has been confirmed the driest July on record for southern England. The same month also saw a record-breaking heatwave with temperatures reaching 40°C for the first time. Precursors to the latest drought were a drier than average winter and spring 2022, and the driest winter-spring sequence since the 1970s. The flow of the River Thames at Reading has been declining since spring 2022 and high evaporation from the exceptionally hot and dry summer has exacerbated this decline. This low flow means that Reading Hydro hasn’t been able to generate electricity since June. So what is the outlook for the coming months?
To look at this, I followed the UKCEH Hydrological Outlook “Ensemble Streamflow Prediction” (ESP) technique based on historical climate to look at the likely river flows over the coming year. Details of the model and technique are in this paper, and the results are summarised in the graphs below.
The black line at the left of the upper graph is the actual flow of the Thames at Reading up to August 2022. Each of the 56 grey lines that continue from August suggest the possible flow for the coming year, modelled by assuming that the rainfall and temperature will be identical to one of the past 56 years. The variation in weather from year to year leads to a large variation in predicted river flow, as anyone who has lived in Reading for a long time would expect. I have highlighted what would happen if we have a repeat of weather from particularly dry years (i.e. 1976, 2003 and 2011).
It’s useful to see the wide range of plausible flow rates, but how do we know what flow is likely on a given future day? The approach I used is to calculate the percentage of simulations falling in defined ‘bands’ of flow rate, which gives the probability that, based on past weather, the flow on a particular day next year will lie within this band, as shown in the lower graph. Here, I’ve chosen thresholds relevant to Reading Hydro: a) 5.24 m/s, the hands-off flow below which we are never allowed to generate, b) 11.44 m/s, the minimum flow required for full generation and c) 37.9 m/s, the average flow of Thames at Reading.
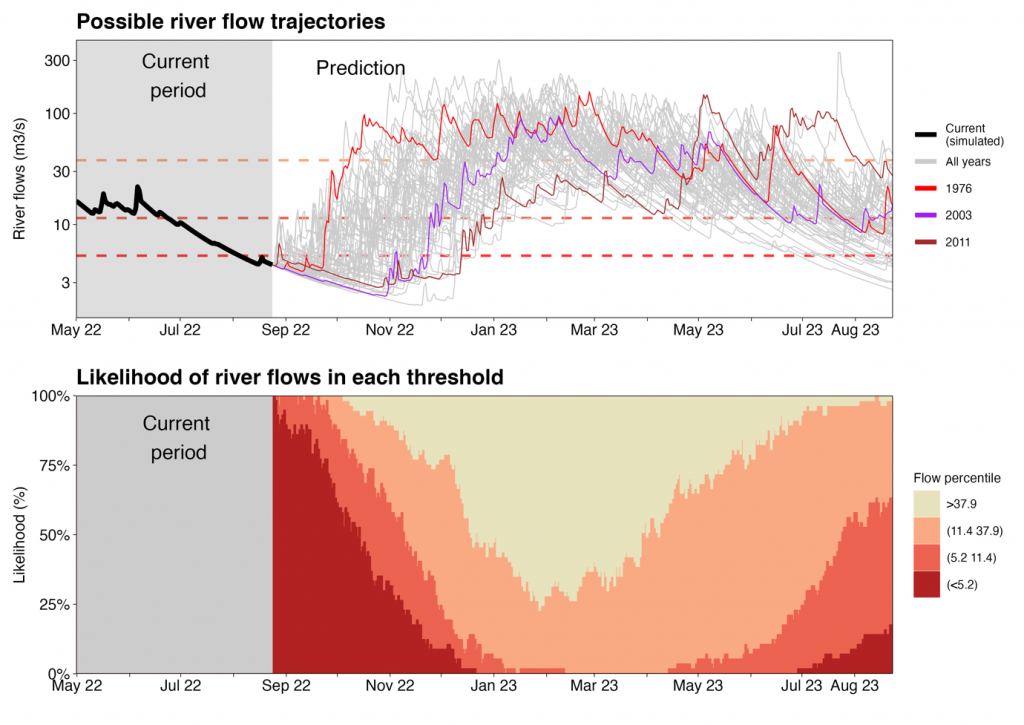
The prediction isn’t very encouraging. It suggests that, without exceptionally high rainfall soon, there is a high likelihood that river flow will be below the level needed for the Reading Hydro turbines to re-start operation, until at least October 2022.