You may have noticed that our data pages were blank for most of last week. This was because we shut the plant down completely on January 6th and disconnected from the grid. Our operating procedures require us to do this if the water upstream reaches a level of 37.4m, to make sure that water doesn’t get anywhere near live wires in the turbine house. Given the huge water flow from persistent rain, that upstream level was fast approaching!
Water was already flooding the turbine house, but our O&M team had seen this coming and everything moveable was off the floor.
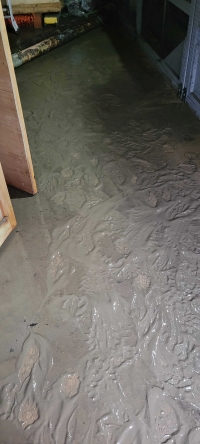
By January 11th the upstream level was falling, so the O&M team went back into the turbine house. A tide mark showed that the water had reached 0.28m (280mm) above floor level, equivalent to an upstream level of 37.38m. The floor was still covered in silt (see photo), but otherwise all was OK.
The team made safety checks and did a lot of floor cleaning. The generating equipment is above the 100-year flood level of 37.91m thus well above the maximum water level reached. However there’s still a risk from condensation in the equipment, so the plant was reconnected to the grid in order to run electric heaters and dry everything out.
Yesterday (January 13th) the O&M team were satisfied that the equipment was dry enough and re-started the plant.
There’s still not enough head of water to generate, but the river flow is coming down from its peak of nearly 280 cubic meters per second and the head is increasing. We hope to be back in business soon.
It’s frustrating to have to shut down when there’s so much water around! But the past two weeks have given us the opportunity to show that our emergency procedures work. Many thanks to all involved.
(typo in the upstream level on January 11th has been corrected)

The peak water level in the turbine house was stated in the article as 37.88 m a.o.d., but that was a typo and should have read 37.38. Actually that was based on an estimate of 28 cm of depth of water above the floor level of 37.10 m, and that in turn was based on a tide mark left on a plywood surface, which I think was affected by capillary rise. My own estimate at the time was a depth outside the turbine house on the footpath (same concrete level) of around 5 cm, i.e. significantly lower.
A design criterion was to ensure that nothing electrical and no sensitive mechanical equipment should be installed below the predicted 100-year flood level of 37.91 m, or 81 cm above floor level. In actuality I think we have quite a significant margin of safety above that level.
The peak water level in the hut of 37.88m compares to 37.54m at the Reading Bridge gauging station, and 37.56m at the lock, according to EA data on the internet. Although the gauging station is upstream of the lock (and so the water level would normally be higher), the recorded water level might be expected to be slightly higher in the lock cut where the fast running under Reading Bridge has been reduced to a very low velocity, so these figures seem believable. However it seems very unlikely that the water level at the Hydro would be 0.32m higher that in the lock cut. Perhaps the floor level of the hut should be checked? For comparison, the lock head water levels in 2003, 1947 and 1894 were 37.53m, 37.83m and 37.95m.
What date was the 100 year flood level reached? Was it 1947?
Past 100 year levels will likely be broken going forward. Environment Agency Thames River Basin Management Plan: This plan estimates a potential rise in sea levels at the Thames Estuary of 0.3-1.7 meters by 2100, depending on the greenhouse gas emission. You should plan accordingly.